New data from England Golf reveals there are 1,735 golf clubs in England and more than 730,000 people are members of golf clubs in England. But what are their ages and which counties have the most clubs and members?
Over 10.2 million scores were submitted through the World Handicap System™ (WHS™) in England in 2024. That number saw competition scores grow to 5.7 million (from 5.4 million in 2023), while general play scores saw an increase from 3.9 million to 4.4 million in the same period.
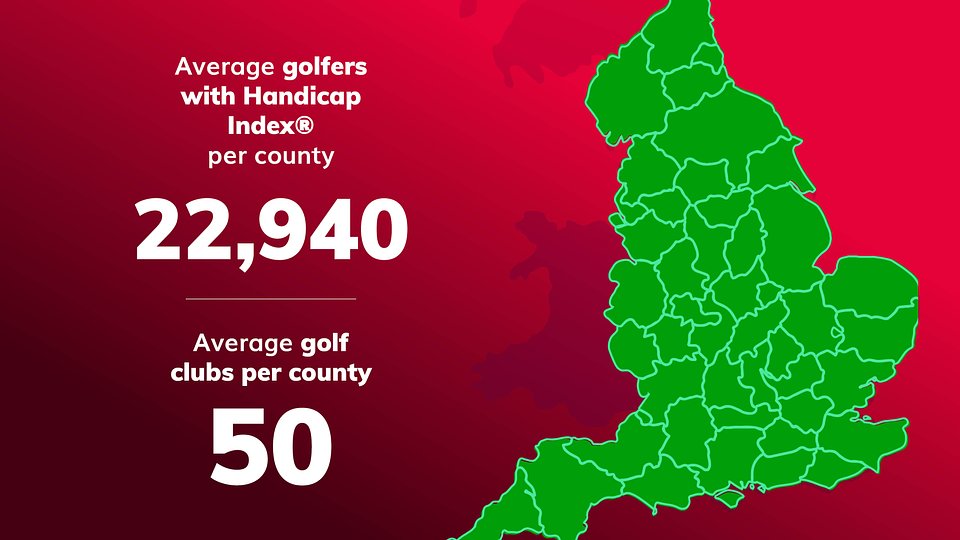
Here’s a breakdown of data in England regarding golf clubs:
Club membership
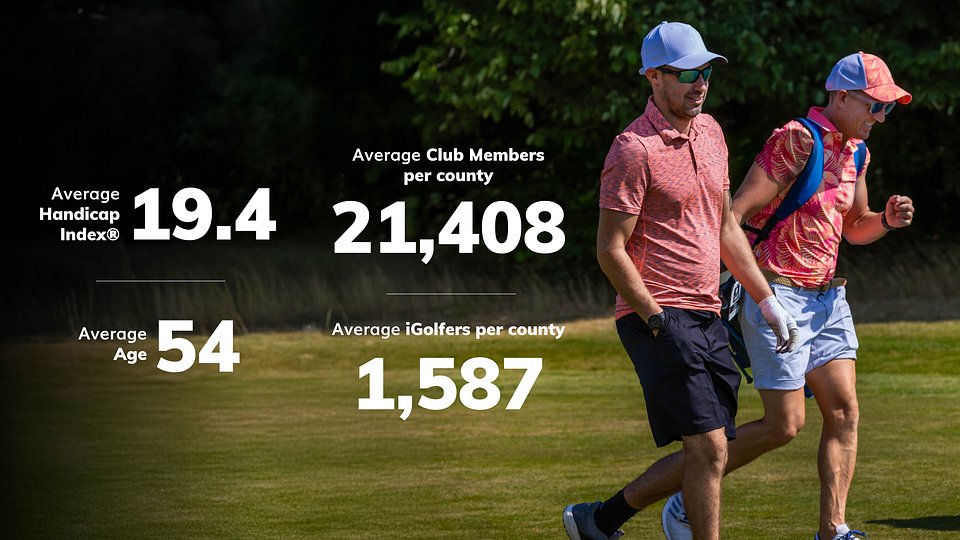
– There are over 730,000 members of golf clubs in England, with the average county including 21,408 golfers.
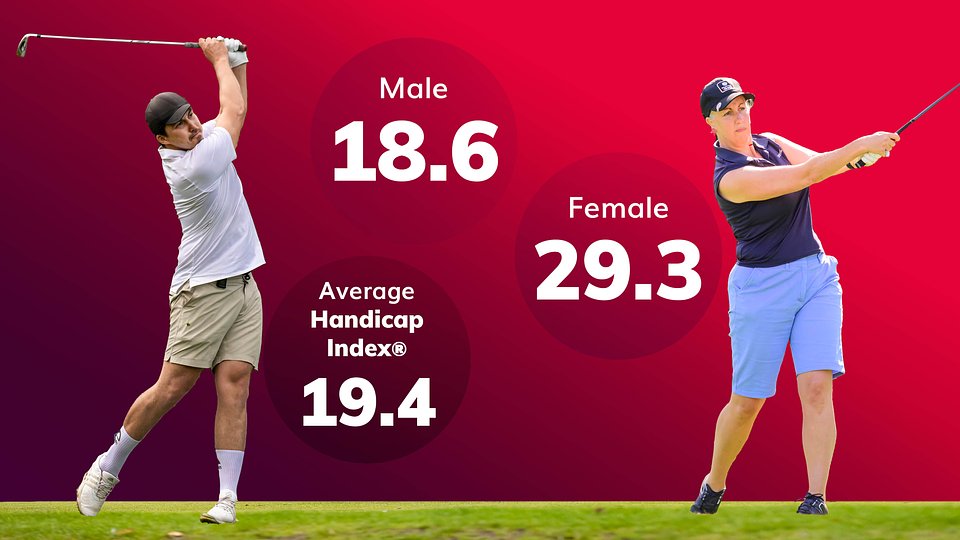
– The average Handicap Index® of golf club members in England is 18.62 (male 17.38, female 28.09).
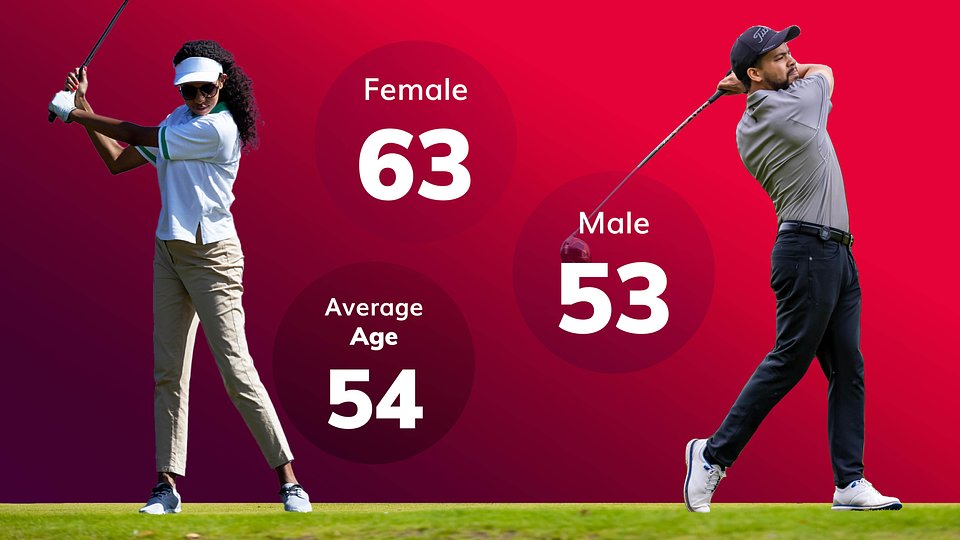
– The average age of golf club members, both male and female, has decreased in England. The average male has gone from 54.98 years of age to 53.78, while the average female age has dropped considerably from 64.65 to 62.98.
– Overall, the average age of club members has reduced from 56.18 to 54.99.
Golf club members
1 Yorkshire 70926
2 Lancashire 49990
3 Surrey 47779
4 Berks, Bucks & Oxon 38998
5 Cheshire 38933
6 Kent 33477
7 Hampshire, Isle of Wight & Channel Islands 32998
8 Essex 29311
9 Sussex 27345
10 Hertfordshire 26819
11 Gloucestershire 20441
12 Durham 20181
13 Staffordshire 19684
14 Lincolnshire 18973
15 Warwickshire 18887
16 Devon 17958
17 Northumberland 15881
18 Suffolk 15593
19 Dorset 14896
20 Nottinghamshire 14103
21 Somerset 14085
22 Worcestershire 14052
23 Norfolk 13548
24 Leicestershire & Rutland 13057
25 Cornwall 12489
26 Wiltshire 12338
27 Middlesex 12147
28 Derbyshire 10535
29 Shropshire & Herefordshire 10283
30 Bedfordshire 10265
31 Cumbria 9741
32 Northamptonshire 9702
33 Cambridgeshire 9617
34 Isle of Man 2825
Golf club members’ average age
1 Isle of Man 51.37
2 Middlesex 52.66
3 Cornwall 53.31
4 Durham 53.45
5 Surrey 53.53
6 Essex 53.86
7 Gloucestershire 54.12
8 Hertfordshire 54.39
9 Kent 54.49
10 Cumbria 54.57
11 Northamptonshire 54.59
12 Yorkshire 54.61
13 Leicestershire & Rutland 54.62
14 Cheshire 54.67
15 Lancashire 54.68
16 Wiltshire 54.89
17 Staffordshire 55.05
18 Suffolk 55.10
19 Northumberland 55.23
20 Derbyshire 55.23
21 Cambridgeshire 55.48
22 Berks, Bucks & Oxon 55.51
23 Somerset 55.56
24 Shropshire & Herefordshire 55.56
25 Bedfordshire 55.64
26 Norfolk 55.82
27 Lincolnshire 55.95
28 Warwickshire 55.97
29 Nottinghamshire 56.00
30 Sussex 56.10
31 Hampshire, Isle of Wight & Channel Islands 56.14
32 Worcestershire 56.21
33 Devon 56.76
34 Dorset 56.93
Golf club members’ average Handicap Index®
1 Isle of Man 16.84
2 Nottinghamshire 17.46
3 Durham 17.47
4 Surrey 17.54
5 Kent 17.83
6 Leicestershire & Rutland 17.93
7 Hertfordshire 17.94
8 Northumberland 18.05
9 Essex 18.24
10 Gloucestershire 18.28
11 Wiltshire 18.51
12 Warwickshire 18.54
13 Northamptonshire 18.60
14 Berks, Bucks & Oxon 18.60
15 Yorkshire 18.66
16 Cumbria 18.67
17 Lancashire 18.69
18 Cheshire 18.89
19 Lincolnshire 19.01
20 Derbyshire 19.04
21 Shropshire & Herefordshire 19.05
22 Bedfordshire 19.08
23 Middlesex 19.09
24 Cornwall 19.37
25 Staffordshire 19.38
26 Hampshire, Isle of Wight & Channel Islands 19.42
27 Cambridgeshire 19.50
28 Sussex 19.51
29 Somerset 19.67
30 Dorset 19.69
31 Worcestershire 19.74
32 Suffolk 19.82
33 Norfolk 19.92
34 Devon 20.16
Average Handicap Index®
1 Isle of Man 16.65
2 Surrey 18.25
3 Kent 18.41
4 Cumbria 18.64
5 Nottinghamshire 18.67
6 Durham 18.79
7 Hertfordshire 18.80
8 Essex 18.80
9 Northumberland 18.82
10 Leicestershire & Rutland 18.94
11 Middlesex & London 19.02
12 Cheshire 19.04
13 Warwickshire 19.06
14 Bedfordshire 19.28
15 Berks, Bucks & Oxon 19.29
16 Northamptonshire 19.29
17 Lancashire 19.34
18 Gloucestershire 19.39
19 Derbyshire 19.54
20 Wiltshire 19.55
21 Yorkshire 19.59
22 Sussex 19.63
23 Shropshire & Herefordshire 19.81
24 Dorset 19.92
25 Staffordshire 20.14
26 Somerset 20.18
27 Lincolnshire 20.23
28 Norfolk 20.30
29 Hampshire, Isle of Wight & Channel Islands 20.31
30 Devon 20.50
31 Worcestershire 20.52
32 Cornwall 20.56
33 Suffolk 20.66
34 Cambridgeshire 20.93
Average age
1 Middlesex & London 47.75
2 Essex 48.43
3 Gloucestershire 48.48
4 Yorkshire 48.69
5 Surrey 48.73
6 Durham 48.75
7 Cambridgeshire 48.84
8 Northamptonshire 48.86
9 Kent 48.93
10 Cornwall 48.93
11 Lancashire 48.96
12 Suffolk 49.00
13 Staffordshire 49.05
14 Shropshire & Herefordshire 49.09
15 Somerset 49.13
16 Hertfordshire 49.15
17 Bedfordshire 49.19
18 Berks, Bucks & Oxon 49.36
19 Cumbria 49.41
20 Lincolnshire 49.41
21 Cheshire 49.42
22 Leicestershire & Rutland 49.44
23 Derbyshire 49.49
24 Norfolk 49.49
25 Isle of Man 49.52
26 Northumberland 49.60
27 Hampshire, Isle of Wight & Channel Islands 49.75
28 Nottinghamshire 49.80
29 Warwickshire 49.90
30 Sussex 49.90
31 Devon 49.98
32 Worcestershire 50.06
33 Wiltshire 50.06
34 Dorset 50.22
Golf clubs per county
1 Yorkshire 181
2 Lancashire 141
3 Berks, Bucks & Oxon 103
4 Surrey 102
5 Cheshire 97
6 Kent 82
7 Hampshire & Channel Islands 76
8 Essex 72
9 Hertfordshire 60
10 Sussex 59
11 Staffordshire 47
12 Lincolnshire 45
13 Warwickshire 44
14 Durham 43
15 Devon 42
16 Northumberland 39
17 Gloucestershire 38
18 Dorset 34
19 Nottinghamshire 33
20 Worcestershire 33
21 Middlesex 32
22 Norfolk 31
23 Cornwall 30
24 Cumbria 29
25 Derbyshire 29
26 Somerset 29
27 Suffolk 29
28 Shropshire & Herefordshire 28
29 Leicestershire & Rutland 26
30 Wiltshire 24
31 Northamptonshire 23
32 Bedfordshire 22
33 Cambridgeshire 19
34 Isle of Man 8
Leave a Reply